

Dissecting SRX RT_FLOW Logs with Splunk
Now that I have a SRX running at home and a syslog server powered by Splunk (free version) it's time to be able to understand the logging. The raw logging is pretty unreadable for the average Joe. Thankfully, Splunk can be used to make more sense of it.
Downside is that I haven't found any add-ons / plugins etc. for Splunk to analyze the logging of a Juniper SRX firewall. There is a post on the Splunk forum which offers two regular expression which can be used to define the RT_FLOW fields.
The regular expressions are (each regular expression is 1 line):
RT_FLOW_SESSION_CREATE:\ssession\screated\s(?P<srx_src_ip>\d+\.\d+\.\d+\.\d+)\/(?P<srx_src_port>\d+)\D+(?P<srx_dst_ip>\d+\.\d+\.\d+\.\d+)\/(?P<srx_dst_port>\d+)\s(?P<srx_svc_name>\S+)\s(?P<srx_nat_src_ip>\d+\.\d+\.\d+\.\d+)\/(?P<srx_nat_src_port>\d+)\D+(?P<srx_nat_dst_ip>\d+\.\d+\.\d+\.\d+)\/(?P<srx_nat_dst_port>\d+)\s(?P<srx_src_nat_rule_name>\S+)\s(?P<srx_dst_nat_rule_name>\S+)\s(?P<srx_protocol_id>\d+)\s(?P<srx_policy_name>\S+)\s(?P<srx_src_zone>\S+)\s(?P<srx_dst_zone>\S+)\s(?P<srx_sess_id>\d+)
RT_FLOW_SESSION_CLOSE:\ssession\sclosed\s(?P<srx_closed_reason>[^:]+)\D+(?P<srx_src_ip>\d+\.\d+\.\d+\.\d+)\/(?P<srx_src_port>\d+)\D+(?P<srx_dst_ip>\d+\.\d+\.\d+\.\d+)\/(?P<srx_dst_port>\d+)\s(?P<srx_svc_name>\S+)\s(?P<srx_nat_src_ip>\d+\.\d+\.\d+\.\d+)\/(?P<srx_nat_src_port>\d+)\D+(?P<srx_nat_dst_ip>\d+\.\d+\.\d+\.\d+)\/(?P<srx_nat_dst_port>\d+)\s(?P<srx_src_nat_rule_name>\S+)\s(?P<srx_dst_nat_rule_name>\S+)\s(?P<srx_protocol_id>\d+)\s(?P<srx_policy_name>\S+)\s(?P<srx_src_zone>\S+)\s(?P<srx_dst_zone>\S+)\s(?P<srx_sess_id>\d+)\s(?P<srx_pkts_from_client>\d+)\((?P<srx_bytes_from_client>\d+)\)\s(?P<srx_pkts_from_server>\d+)\((?P<srx_bytes_from_server>\d+)\)\s(?P<srx_sess_elapsed_time>\d+)
To use these field extractors you must select the 'Extract Fields' at the starting of a log line by clicking the pulldown-menu.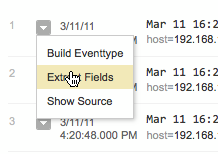
In the following page select the corresponding logfile (when applicable) and click on 'Edit'.
;)
Enter one of the regular expressions in the pop-up dialogue.
;)
If all goes well you get some sample results. Click save to save the field extractions.
;)
After you've added both regular expressions you can use them during the examination of the SRX log files.
;)
;)
I hope that someone develops a (free) plugin for Splunk that does a bit more. There are numerous plug-ins for Cisco device logs and other vendors. Juniper seems to be the only one who's absent.....
More on Field Extraction on the Splunk website.
 Willem
Reader Comments (1)
On the post that you originally link, I've also created and added additional extractions for RT_SCREEN extractions. This will allow you to dissect your screen results with SPLUNK for your SRX.